Group Project

Outbreak.io

Real-time outbreak tracking and health safety platform for NYC residents and health professionals.

Outbreak.io is a real-time public health platform that combines user reports, public health data, environmental data, map layers, and machine learning models to visualize local health risks and forecast future outbreak activity.

Outbreak.io
Screenshots
Map heatmap / forecast layers visualMap heatmap / forecast layers
Homepage hero visualHomepage hero
Report a Case flow visualReport a Case flow
Disease Informatics visualDisease Informatics
My Role

As part of the team, I focused on the backend/API, MongoDB database structure, data pipelines, analytics dashboard, disease informatics features, and integration of the symptom-based machine learning classification model.

  • Designed and set up the MongoDB database structure for storing reports, events, health data, and application data
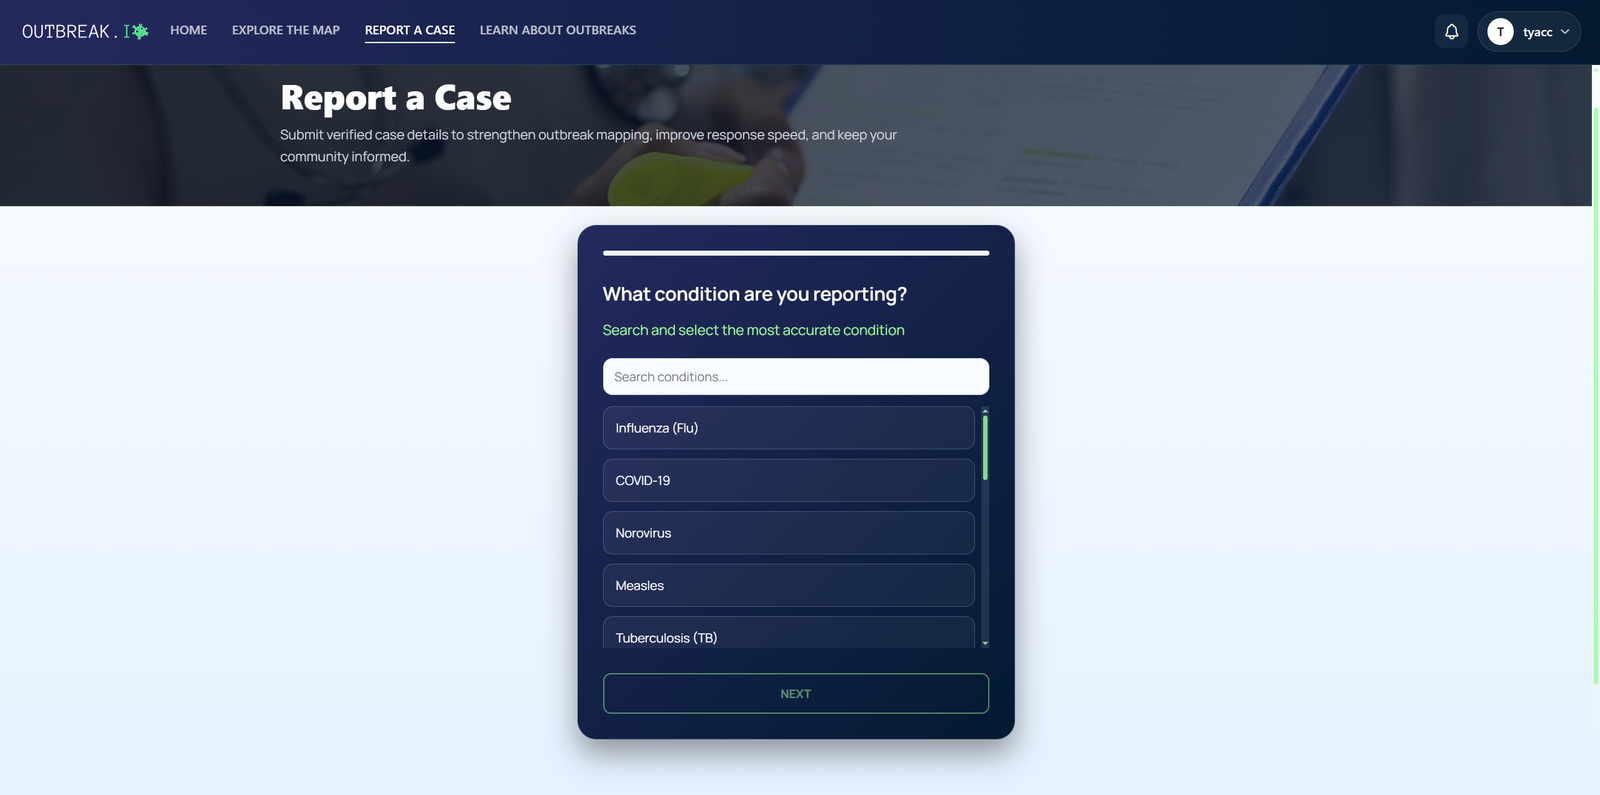
  • Built backend/API functionality to support reporting, dashboard, disease informatics, and data access features
  • Created data pipelines and integrations for organizing health, report, and analytics data
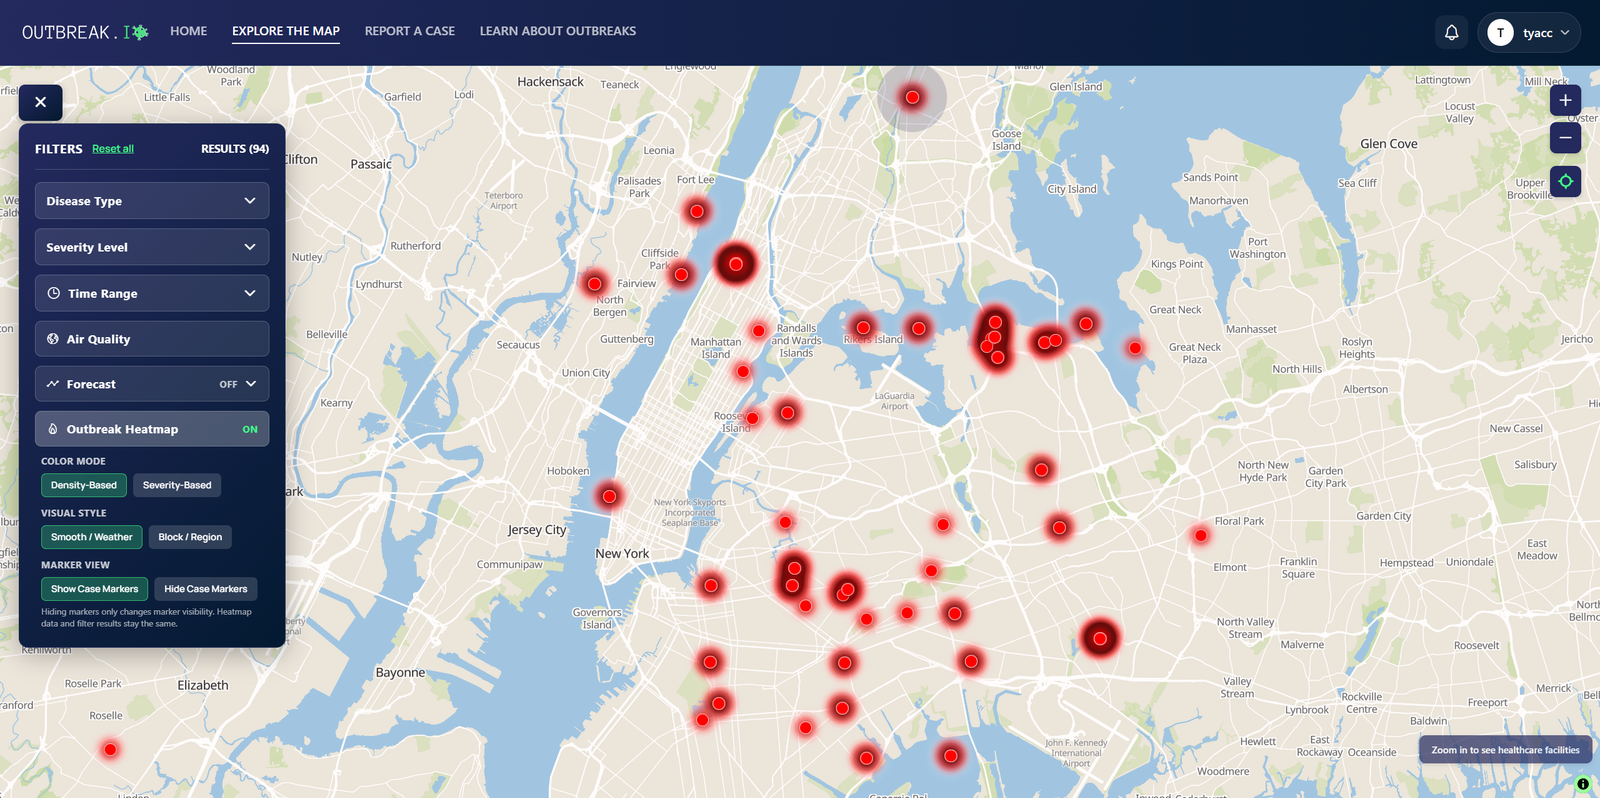
  • Developed analytics dashboard features for monitoring reports, trends, and outbreak-related information
  • Built disease library/informatics features covering symptoms, transmission, treatment, and prevention information
  • Integrated the symptom-based machine learning classification model into the application workflow
Problem

People often rely on delayed dashboards, scattered news updates, or social media to understand illness trends. Outbreak.io was built to make health signals more local, visual, and actionable.

Solution

Built as a senior project at The City College of New York, the platform helps NYC residents and health professionals understand local health risks through reports, datasets, environmental signals, interactive geospatial visualizations, classification, and forecasting.

Impact

The project translates outbreak signals into local, visual, and actionable information for residents, while giving healthcare officials a dashboard-oriented workflow for reviewing reports, trends, applications, users, and support requests.

Key Features
  • Interactive NYC outbreak map with disease, severity, time range, AQI, heatmap, forecast, and healthcare facility filters
  • Guided symptom and case report submission flow
  • Symptom-based machine learning classification model integrated into the application workflow
  • Outbreak forecasting model for estimating future local risk
  • Disease informatics and healthcare/admin dashboard features for understanding cases, trends, and support workflows
Tech Stack
  • React
  • React Native
  • Expo
  • TypeScript
  • Node.js
  • Express
  • MongoDB
  • MapLibre
  • Python
  • scikit-learn
  • FastAPI
  • Vercel
  • Render
  • GitHub